When it comes to LCA, perfection is the enemy of good. In this post I want to introduce you to some of the supply chain data collection challenges we encountered while working with more than 150 fashion brands. That experience led us to design the Uncertainty Metric, a pragmatic solution to prioritize data collection efforts.
Each LCA result comes with an error margin.
Here is a little secret from the life cycle assessment world: each result comes with an error margin.
Let's take carbon as an example. Measuring a product carbon footprint with a 0% uncertainty result would mean that you can quantify the precise amount of carbon that was released at each step of the production process from raw materials extraction to the disposal of the product. How much fertilizer was used to grow that amount of cotton? How much energy was used by that weaving mill to make that specific yarn? How many times did the end consumer wash that product? Did it end up in a landfill or was it recycled?
You see that the exercise is almost impossible to conduct. Even if you can use advanced tools to trace your supply chain and pinpoint which factories are involved, being able to allocate the amount of energy used for a specific production step requires physical submetering that just does not exist in most factories. Or in some cases the traceability of the raw material (e.g: the cotton farm) is not even known from the supplier that bought it.
Data collection: Primary, secondary data
Collecting the true amount of energy that was used during a production process is what we called primary data. Primary data is the holy grail. But what do you do when you don't have access to primary data? You use secondary data.
Secondary data are available in databases such as Ecoinvent, EF 3.1, Mistra Future Fashion, BaseEmpreinte and more.
Let’s take an example: say you want to understand the carbon footprint of a cotton shirt. One key process to consider is called weaving. During that step, a loom transforms the cotton yarn into a fabric.
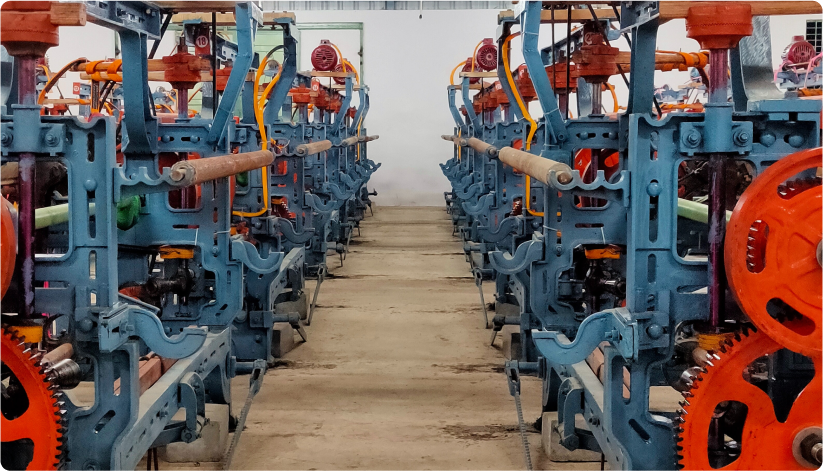 A picture of a loom (cc Shaikh Irfan)
Looking up in LCA databases, we find emission factors such as “weaving 1kg of cotton yarn with 119/114 dtex requires 8Kwh of energy”[1]. The dtex here refers to the “thickness” of the yarn. It is measured in grams per 10,000 meters of that yarn. It makes sense to consider that yarn characteristic as you will need more energy to produce 1kg of fabric with a thinner yarn.
But that comes with an extra difficulty: we now need to know the dtex of the initial yarn to get a proper understanding of the energy usage of the weaving step. That information is likely not easily available in a brand information system.
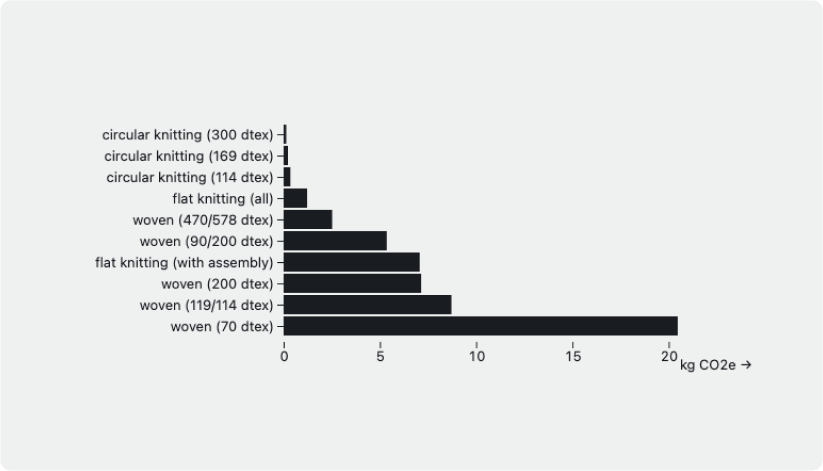 Emission factor of textile formation depending on the thickness of the yarn and the type of process[2]
To make things even more difficult, here is another little secret, the emission factors between databases may not even match! Indeed, each emission factor may come from a study conducted at a different time, with a different machine, with a different allocation method or with a different background process. Below is for instance the amount of kgCO2e released to produce 1kg of raw Merino wool among few popular LCA databases:
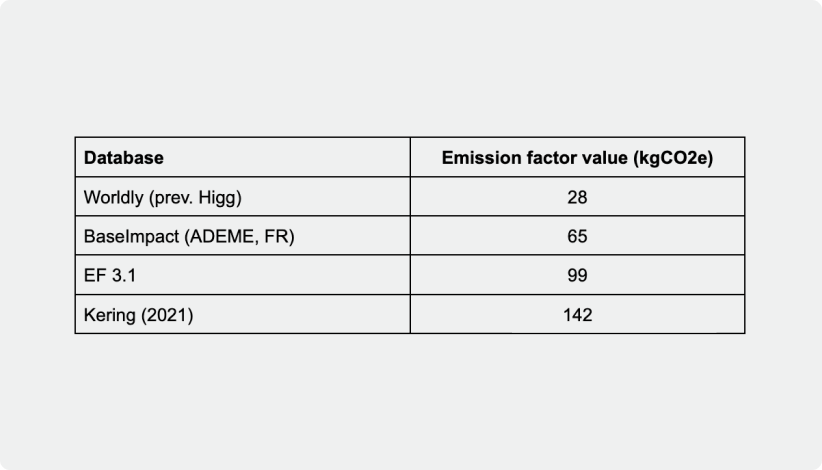 Comparing how much CO2e is emitted to produce 1kg of raw Merino Wool
Carbonfact's Uncertainty metric
To overcome the challenges highlighted above, we designed the metric carbon uncertainty. It corresponds to the difference between the maximum and minimum emission factor value multiplied by volume. Here is an example on a sample dataset that includes two materials:
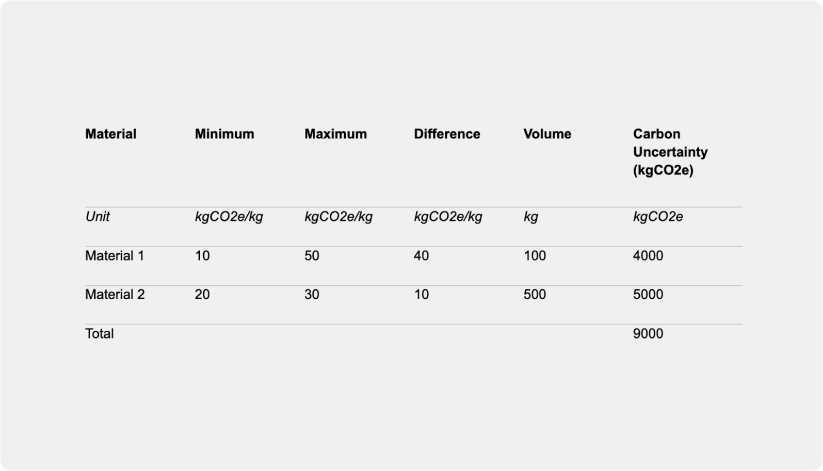
In the example above, material 2 has a higher Carbon Uncertainty than material 1. It makes 55% of the overall Carbon Uncertainty (5000 / 9000). We should then spend more time collecting data for Material 2 if we want to reduce our overall Carbon Uncertainty.
That logic is flexible and can be applied to other data points we have limited knowledge about. For instance you may want to use it for component-level weights (e.g the weight of the outsole of a shoe). That information is rarely available in a brand system. You can then express those as ranges (e.g: [200 - 600g]) rather than fixed average values. Once those ranges are defined, our LCA engine combines those and returns a footprint with the associated error margin.
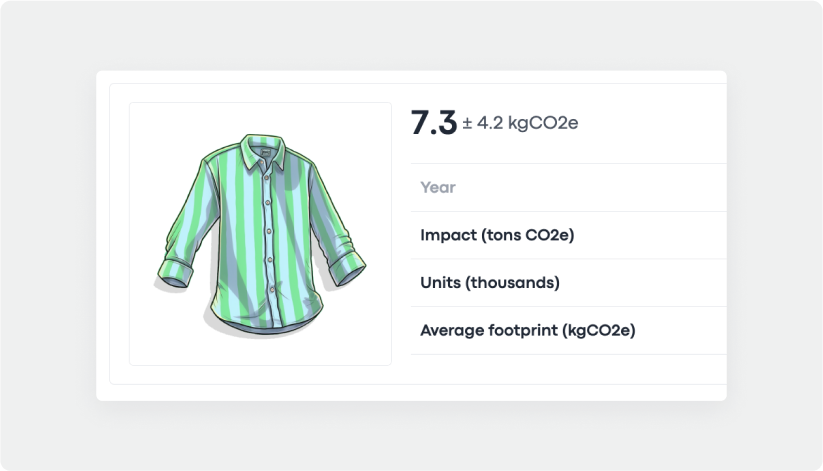 An example of a footprint and the associated error margin from the Carbonfact platform
Prioritizing data collection effort
The uncertainty metric is displayed throughout the Carbonfact platform. Our customers can break it down by product style, supplier or material. Doing so they can prioritize accordingly where to spend their time to collect additional data on their supply chain in the most efficient manner.
As it is expressed in the same unit (tons of CO2e) we can easily trade off which data point should be collected first. For instance it might make more sense to know the dtex of the fabric used in product A,B and C than to collect the precise weight of a component of product D.
.jpg?width=1200&height=630&name=Newsletter%20image%20Uncertainty%205%20(2).jpg) A screenshot of the Carbonfact platform that displays uncertainty per material
A screenshot of the Carbonfact platform that displays uncertainty per material
When we start partnering with a brand, we compute an uncertainty baseline. That baseline helps us then define goals. Does the brand want to put a lot of effort and cut uncertainty by half? Should we instead shoot for a smaller reduction given that the sustainability resources are limited?
Eventually uncertainty decreases after a round of data collection iterations. As an example, below is a graph of a brand we work with. They managed to cut their uncertainty by more than half since the start of our collaboration.
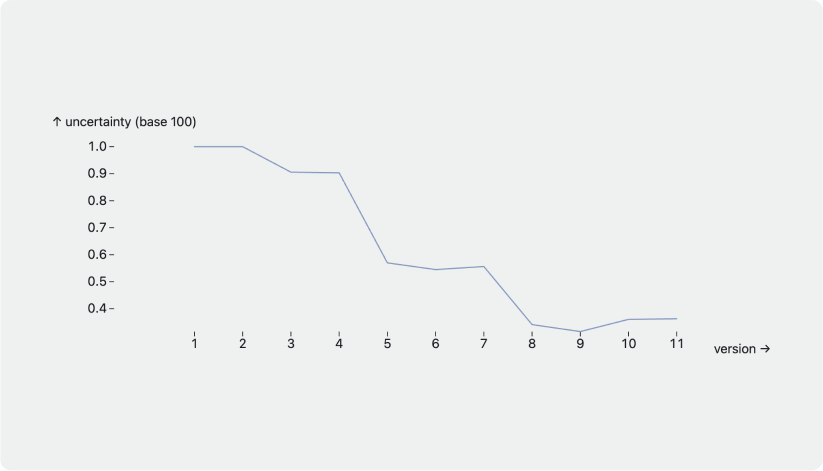 An example of a customer that managed to reduce overall uncertainty. The baseline is defined in version 1. Uncertainty keeps decreasing as we publish more versions with better data [3]
[1] Mistra Future Fashion, 2019
[2] Data sources include Ecoinvent, Mistra Future Fashion
[3] Carbonfact internal data



 Lidia Lüttin

![[Guide] Carbon accounting for fashion, textile, apparel, and footwear companies](https://www.carbonfact.com/hs-fs/hubfs/CA%20-%20Opt1.png?width=600&name=CA%20-%20Opt1.png)
 Angie Wu