![[Guide] Carbon Accounting for Apparel and Footwear Brands](https://www.carbonfact.com/hs-fs/hubfs/Imagery%20template%20%289%29.png?width=412&height=244&name=Imagery%20template%20%289%29.png)
-1.webp?width=412&height=244&name=YAWA%20template%20(1)-1.webp)

Environmental intelligence platform - built for apparel and footwear brands, and their suppliers.

This new version of Ecoinvent 3.10 brings updated electricity and heat production data, reflecting recent updates in market mix and energy policies.
The Ecoinvent database provides comprehensive life cycle inventory datasets, essential for assessing the environmental impact of apparel and footwear products. The database includes detailed information on the cultivation, processing, and transportation of raw materials, as well as the manufacturing processes involved in the textile sector.
Each activity in the database is attributed to a specific geographic location, allowing us to trace the impacts of your products throughout the entire supply chain. Importantly, the processes in Ecoinvent represent average production conditions within these geographical locations, rather than company-specific or site-specific conditions.
For example, the database would contain data for the average process of t-shirt assembly in China, instead of focusing on a specific textile supplier’s factory. This approach helps standardize environmental impact assessments and provides a broad view of potential impacts based on regional production practices.
The electricity and heat data in Ecoinvent 3.10 reflect more recent energy mixes and policies from countries around the globe as of 2020, with specific updates for Brazil, China, the USA, Canada, Switzerland, and India to 2021 levels.
The transition to Ecoinvent 3.10 has brought changes in the emission factors for many countries, reflecting recent updates in market mix and energy policies, such as the influence of the Ukraine conflict.
Notably:
Increases in GHG Emissions: Countries in Africa, Southeast Asia, and Central/South America have shown significant increases in their greenhouse gas emissions. For example, Honduras (75%), Colombia (70%), and Myanmar (55%) have experienced major increases in emissions due to changes in their energy production and consumption patterns.
Decreases in GHG Emissions: Several European countries have seen notable decreases in emissions, such as Spain (30%), Portugal (33%), and Denmark (39%), reflecting their successful efforts in integrating more renewable energy sources and reducing reliance on fossil fuels.
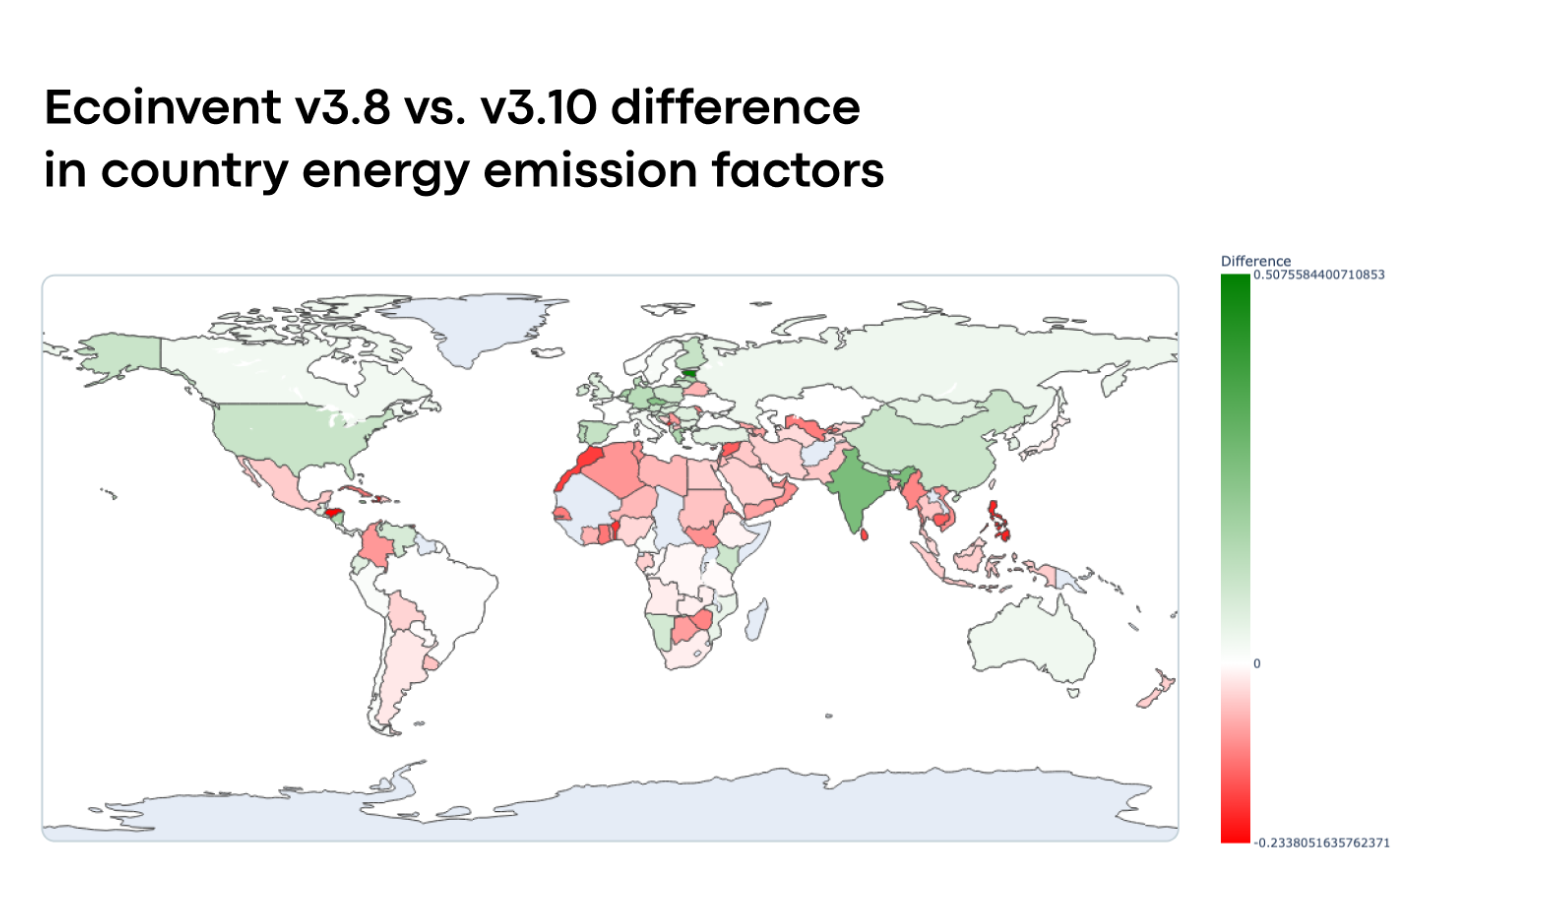
Green = country reduced energy emissions, Red = country increased energy emissions
At Carbonfact, we prioritize the accuracy and relevance of the environmental data provided to our customers. Recently, we have integrated Ecoinvent 3.10 into our LCA engine and updated our energy emission factors based on the most recent data available.
This upgrade ensures that the environmental impacts calculated through our platform reflect the most current scientific data and energy policies in different countries. Read more about it here.


Environmental intelligence platform - built for apparel and footwear brands, and their suppliers.